I love Wind!
Wind is good, anytime…anywhere! I like how they look and I like what they do.
But, have you ever noticed that all the success claims relate to how much wind capacity has been installed, rather than how much power that has been generated.
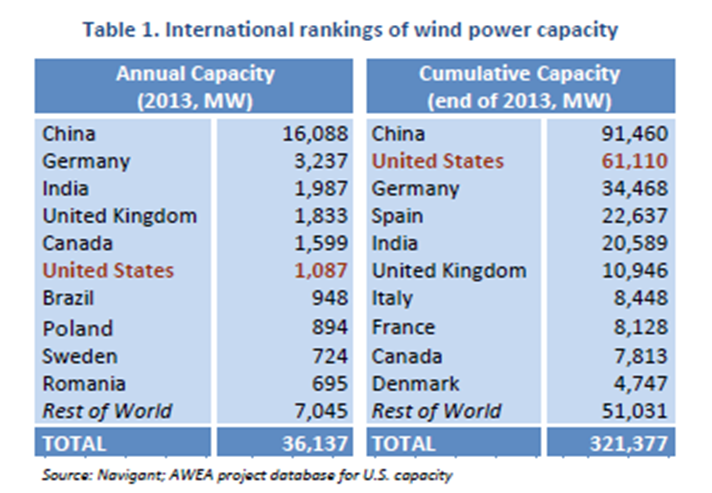
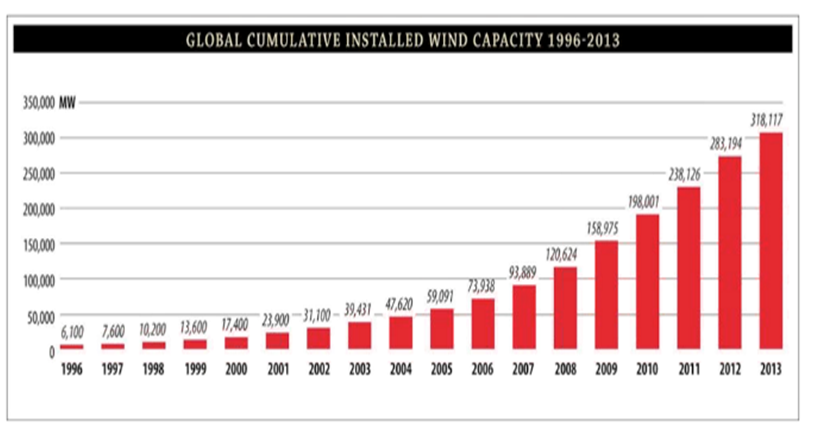
To illustrate, here’s some recent data on installed capacity:


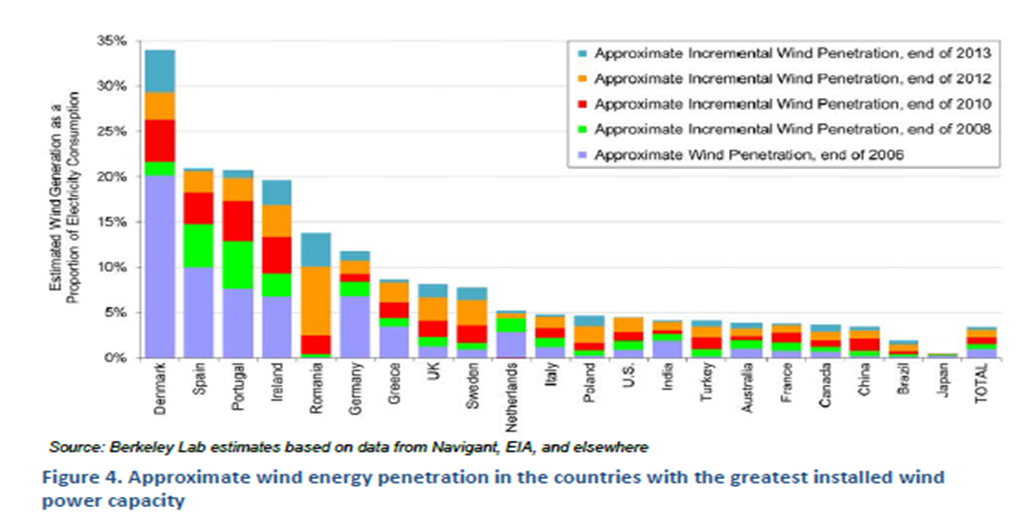
There is some information available on wind energy penetration into the overall electricity consumption. As can be seen from the chart shown below, the U.S., as a point of comparison indicates that wind accounted for just under 5% of electricity consumption in 2013, an approximate 4x increase over 2006.

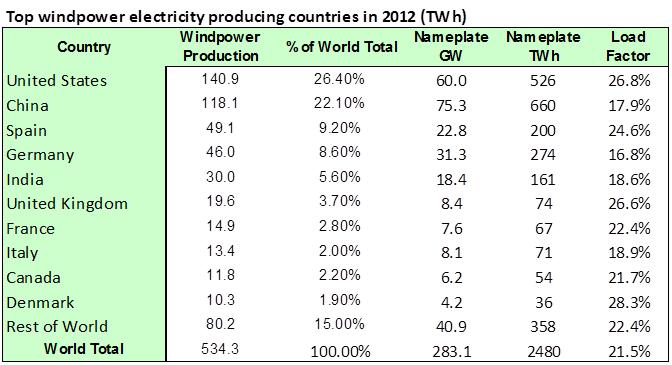
In terms of Climate Change impact and specifically in terms of the CO2 emissions profile, load factor is more interesting.Wikipedia provides some wind data by country, tabulated below.

The data suggests that load factors typically vary between 20% and 30%.No surprise here.Most of these wind projects tend to be driven by first cost and today these wind assets are backed-up by natural gas-fired, simple-cycle gas turbines to manage the intermittent wind resource. These types of simple cycle units are required by the EPA New Source Performance Standard to not exceed 1100 lb-CO2/MWh.
The combined effect of 30% at zero lb-CO2/MWh, plus 70% at 1100 lb-CO2/MWh, would deliver 770 lb-CO2/MWh in the best case, but some of these simple cycle units operating at part or varying load struggle to meet 1100 lb-CO2/MWh and at a 20% load factor, that combination would yield a value closer to the combined cycle CO2 threshold without abatement of 1000 lb-CO2/MWh.
