What does a 32% reduction in power plant CO2 emissions by 2030 that really mean?
Let’s start with the data.
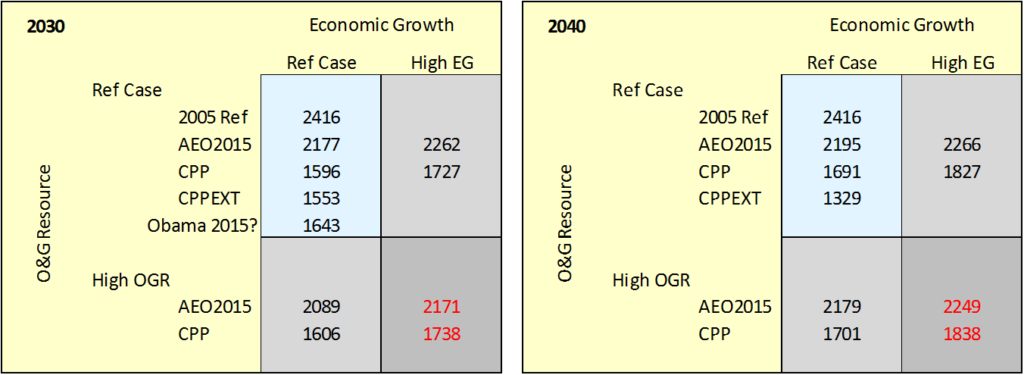
The U.S. Energy Information Agency (EIA) has published its “Analysis of the Impacts of the Clean Power Plan”, and within it, It has evaluated a number of scenarios and included the relevant 2005 and 2013 historical data used as the referenced starting points.
The scenarios of most interest include the Reference Case (AEO), as published in the Annual Energy Outlook 2015 (AEO2015), and the Base Policy (CPP) reflecting the full implementation of the Clean Power Plan.
Two sensitivities for these cases are presented; the High Economic Growth (AEOHEG), and the High Oil and Gas Resource (AEOHOGR). These sensitivities are shown for both the AEO Reference Case and for the CPP Policy Case. The combination of High Economic Growth AND High Oil and Gas Resource is not presented. The red numbers in the following tables are my best guess at the combined effects.
The 2005 reference value for Electricity Production is 2416Mt. Therefore, a 32% reduction would mean a target of 1643Mt by 2030. (Mt) is the abbreviation for million metric tonnes (2416Mt = 2.416Gt).
The base CPP case allows existing coal-fired plants to operate at a higher utilization rate, rising from a low of 60% in 2024 to 71% in 2040.
There is a Policy Extension case (CPPEXT) which extends CO2 reduction targets beyond 2030 and assumes a further reduction in CO2 emissions from the power sector to 45% below 2005 levels by 2040. The 2040 target for the Policy Extension case is 1329Mt and is presumed to be met with by a further shifting of power generation from coal to natural gas.
Here are the 2030 values, presented in the AEO2015 along with the new target just announced by President Obama. I have also presented the AEO 2040 cases.There are no 2050 cases in the AEO2015.

CO2 Emissions from Electricity Production – Values are Million metric tonnes (Mt)
Does a 32% reduction in Electricity Production by 2030 get us to a 2°C/450ppm target by 2050?
Firstly, no one is asking this question.
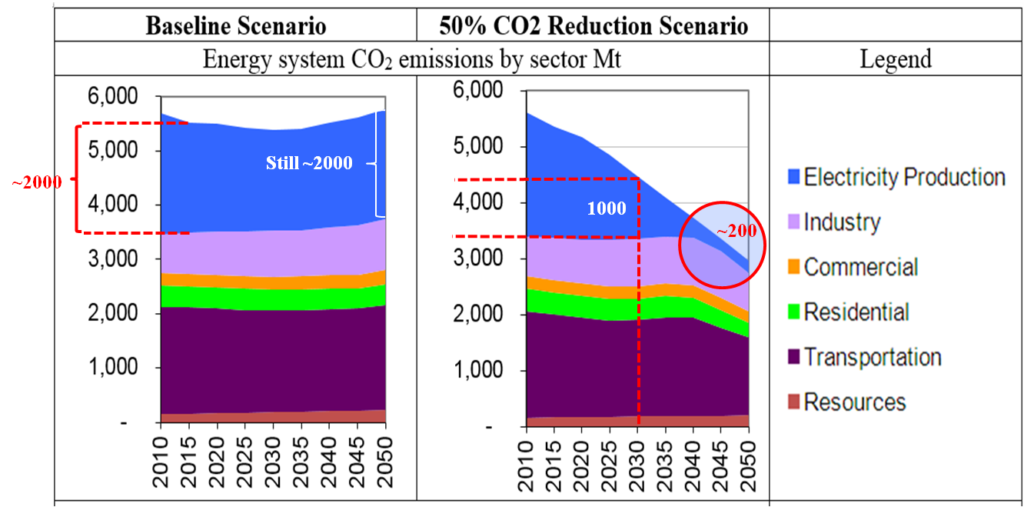
The following charts were presented by the EPA at a Supercritical CO2 Conference in 2014.They are the results of a road-mapping exercise that looked at the CO2 emissions issue through 2050.

Source: DOE SCO2 Conference 2014, as presented by EPA
The Baseline Scenario lines up with the roughly 5600 – 6000Mt levels for the U.S. baseline for all sectors, depending on which data set is being used. The Baseline Scenario is ~2200Mt level for Electricity Production and shows an early 10% decline in 2030, but then remaining relatively constant at 2000Mt through 2050.
The 50% reduction strategy indicates the 5600Mt dropping to 4400Mt by 2030, and to just under 3000Mt by 2050. The previously reported MIT-Mike Orcott analysis indicated a U.S. goal of 1300Mt, shown as 1.3Gt, would be required to achieve a 2°C/450ppm target. This seems consistent with the 50% CO2 Reduction road-mapping data.
In the 50% reduction scenario, the Electricity Production contribution is 1000Mt by 2030, dropping to 200Mt by 2050. The 2030 value appears to be a 38%, “fair share” value for Power Generation, while the 200Mt in 2050 indicates a disproportionately larger contribution from Electricity Production, consistent with its ability to capture carbon at its large point sources. On a proportionate basis, CO2 from Electricity Production in 2050 might be 500Mt.
These two values, 200 and 500Mt, represent the 2050 target range for Electricity Production to achieve its share of a 2°C/450ppm target.
The Obama 2015 goal of 1643Mt by 2030 is not materially different from the two CPP sensitivity cases, shown either individually, or with the combined effect.And, it does not matter whether the 2030 or the 2040 comparison is used. In all but the Policy Extension case, the emissions from the Electricity production is still 3-4X what would be required to achieve a 2°C/450ppm target by 2050.
The Policy Extension case, which presumes a continued shift from coal to gas but lacks specifics, is still 3X what would be required. Some would call this “magical thinking”.
So, the short answer is that 32% by 2030 is a start, but these actions alone and their simple extensions are not nearly good enough!
The Policy Extension is almost entirely dependent on a further shift from coal to natural gas generation, plus added renewables. As reported earlier, the effect of the coal-to-gas shift may be overstated. In addition, all these cases seem to ignore any shift to electric vehicles and the attendant increase in power generation required to support it.
Simply stated, in order to achieve a 2°C/450ppm 2050 goal, we have to address the emissions from NGCC power plants. We can certainly apply CCS to NGCC power plants before 2030, but the EPA has chosen to defer this opportunity through their 1000 lb- CO2/MWh emissions standard threshold, which allows NGCC power plants to operate completely unabated.
The most direct approach would be to apply CCS to NGCC and use the lower cost of natural gas to offset the added cost of CCS. This approach would not require an entirely new power plant concept, as is the case with IGCC or whatever, and we would actually then be on the CCS learning curve.
It appears that the EPA is avoiding the “opportunity” to implement CCS by setting the regulations at a level that does not require it, banking on fuel-switching to make progress. And, yes, progress is being made, but we are knowingly not on a trajectory that will deliver 2°C/450ppm by 2050.
I think that this is why all the targets are expressed as percentage reductions rather than progress toward a defined end goal.
