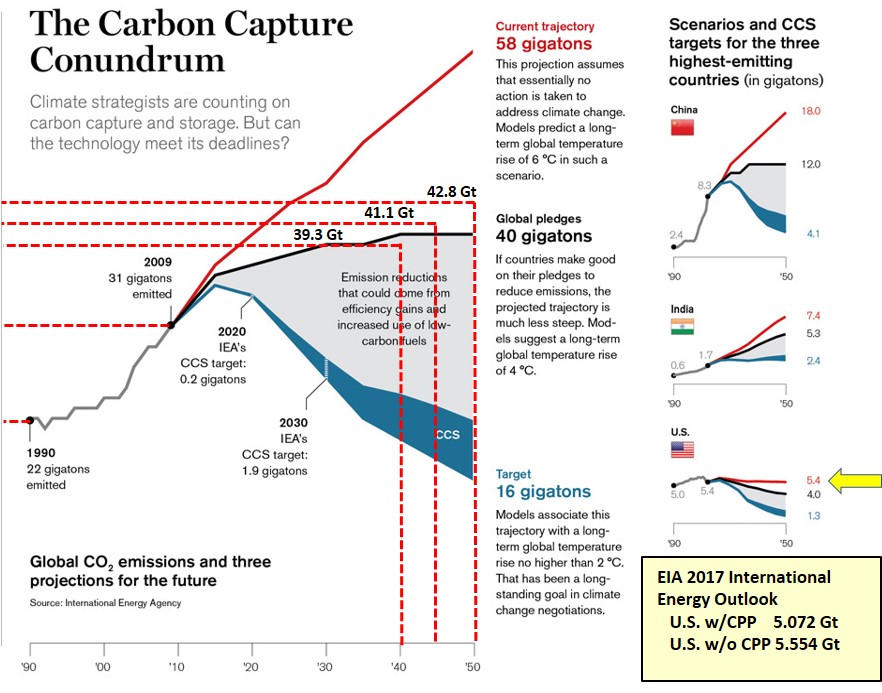
The EIA released their Annual Energy Outlook for 2018 in January. The forecast includes 10 different cases/scenarios, visible in the table generated using their browser tool.
I have rank-ordered these 10 scenarios from a high to low impact in year 2050, and I have also provided some macroeconomic data for reference. The two Reference Cases, with and without the impact of the Clean Power Plan (CPP), are shown.

Without going into the detail again, this forecast suggests we are on the “red line” trajectory toward 58Gt, worldwide detailed in my September 2017 blog. The U.S. portion of that outcome is 5.4Gt, which we would hit in any of the top five scenarios.

